The Shashe catchment of the Limpopo Basin in Botswana and Zimbabwe is a dry place: the Shashe River flows for just a few days a year, and 10 recently built dams are usually the only visible signs of water. But in the complex world of water storage, not everything is visible.
“Usually, people believe that dams store the largest amount of water,” explained IWMI researcher Dr Girma Ebrahim during this year’s World Water Week. “But a significant proportion of water storage in the Shashe catchment is in the soil.” Indeed, his team’s water storage assessment combined a host of data from remote sensing, models, and maps to show that while the Shashe’s artificial reservoirs hold a cumulative 700 million cubic meters at full capacity, the catchment’s soils, when saturated, hold as much as 1,500 million cubic meters. However, variations over time are just as important to consider as total volumes. Soil moisture rises and falls rapidly with the seasons, whilst reservoir levels are steadier. On a smaller scale, sand dams also help rural communities keep water available – a tiny fraction of storage but a locally important one.
You can’t understand a catchment’s water storage story without looking everywhere, both in time and space: that was the message of the NEXUS Gains-led session at World Water Week, Integrating Water Storage: First Steps in Assessment, Progress toward Incentives, which doubled as the latest edition of the NEXUS Gains webinar series.
Mapping water storage
Session leader Jonathan Lautze, a Research Group Leader at IWMI and NEXUS Gains Coordinator for Southern Africa, emphasized the significance of the charts in Ebrahim’s presentation. “These images are some of the first efforts, in our view, to put the volumes of different water storage types together in the same place, and also to consider their seasonal variations. To me, this is the crystallization of what we’re trying to do: to put them on the table and allow these to be considered in planning.”
A second example followed from a parallel assessment in a very different catchment: the Ramganga catchment of Uttar Pradesh, India, the first major tributary of the Ganga. IWMI’s Dhyey Bhatpuria unveiled the findings from this busy agricultural basin, which receives 80 percent of its rain during the monsoon season. His study mapped spatial and temporal changes, combining surface storage detection from satellite imagery (no small task in a catchment with 3,000 patches of open water during the paddy season) with groundwater data from government surveys. “How to use them both together?” Bhatpuria asked. “Total surface water gain, along with the year-end volume and net groundwater availability, can be a good indicator of the carry-forward of water from one year to the next.”
Connecting scales, connecting users
The importance of these assessments was well framed in an opening presentation by William Rex from the World Bank, who sketched the context of water storage and why we need to better understand when and where water is stored. Rex emphasized the great diversity of water storage in different forms, different scales, and different time scales – as “storage” may be for just a few minutes in a fast-draining gully, or for thousands of years in an aquifer.
“But we’re also talking about different stakeholders,” Rex added. “Perhaps there was a world once where it made sense for different stakeholders in the same environment to have their unique forms of storage that they would use for their purposes. But if we start to understand storage as an integrated system, it makes less and less sense … because of course fundamentally it’s all connected.”
“Doing” integrated storage
So what does it really mean to plan and “do” integrated water storage? This was the focus of a panel discussion in the second half of the session, which was facilitated by Professor Jennie Barron from the Swedish University of Agricultural Sciences.
During the panel discussion, ICRISAT’s Dr Kaushal Garg spoke of another experience in Uttar Pradesh, where the integrated modernization of a traditional rainwater harvesting system has raised the water table and spurred more commercial crop choices. Markus Hoffman from the Federation of Swedish Farmers brought a very different perspective from a country with extensive infrastructure to drain farmland, but where recent droughts have cost billions in harvest losses and there is a recognition that more water storage is needed.
Davies Saruchera from IUCN rounded out the panel with a revealing story from the Buzi, Pungwe, and Save (BuPuSa) Basin in Mozambique and Zimbabwe. Here, IUCN worked to promote nature-based storage solutions such as wetland management while the two governments were rapidly building dams to counter droughts and floods. Saruchera reflected on the need to integrate not just actions but two counter-narratives from disconnected actors – a challenge and opportunity for the new BuPuSa Watercourse Commission.
Worldwide opportunity
Integrated water storage assessment can set the stage for better coordination, concluded World Meteorological Organization’s Dr Stefan Uhlenbrook, who gave final remarks to what he called “the most technical and inspiring session” he’d heard at a packed World Water Week.
“I think you are collecting the necessary data and information to really go the next steps … to really scale that and bring that to the attention of [World Meteorological Organization] member states so they heavily invest in it,” Dr Uhlenbrook said. “It would be quite powerful if in the coming years we could work toward technical guidelines or even technical regulations,” he reflected, “because I really see this is a key solution for climate change adaptation.”
Didn’t catch the webinar? You can watch it here.
Learn more about all the webinars in the series on the NEXUS Gains Talks landing page.
This work was carried out under the CGIAR Initiative on NEXUS Gains, which is grateful for the support of CGIAR Trust Fund contributors: www.cgiar.org/funders
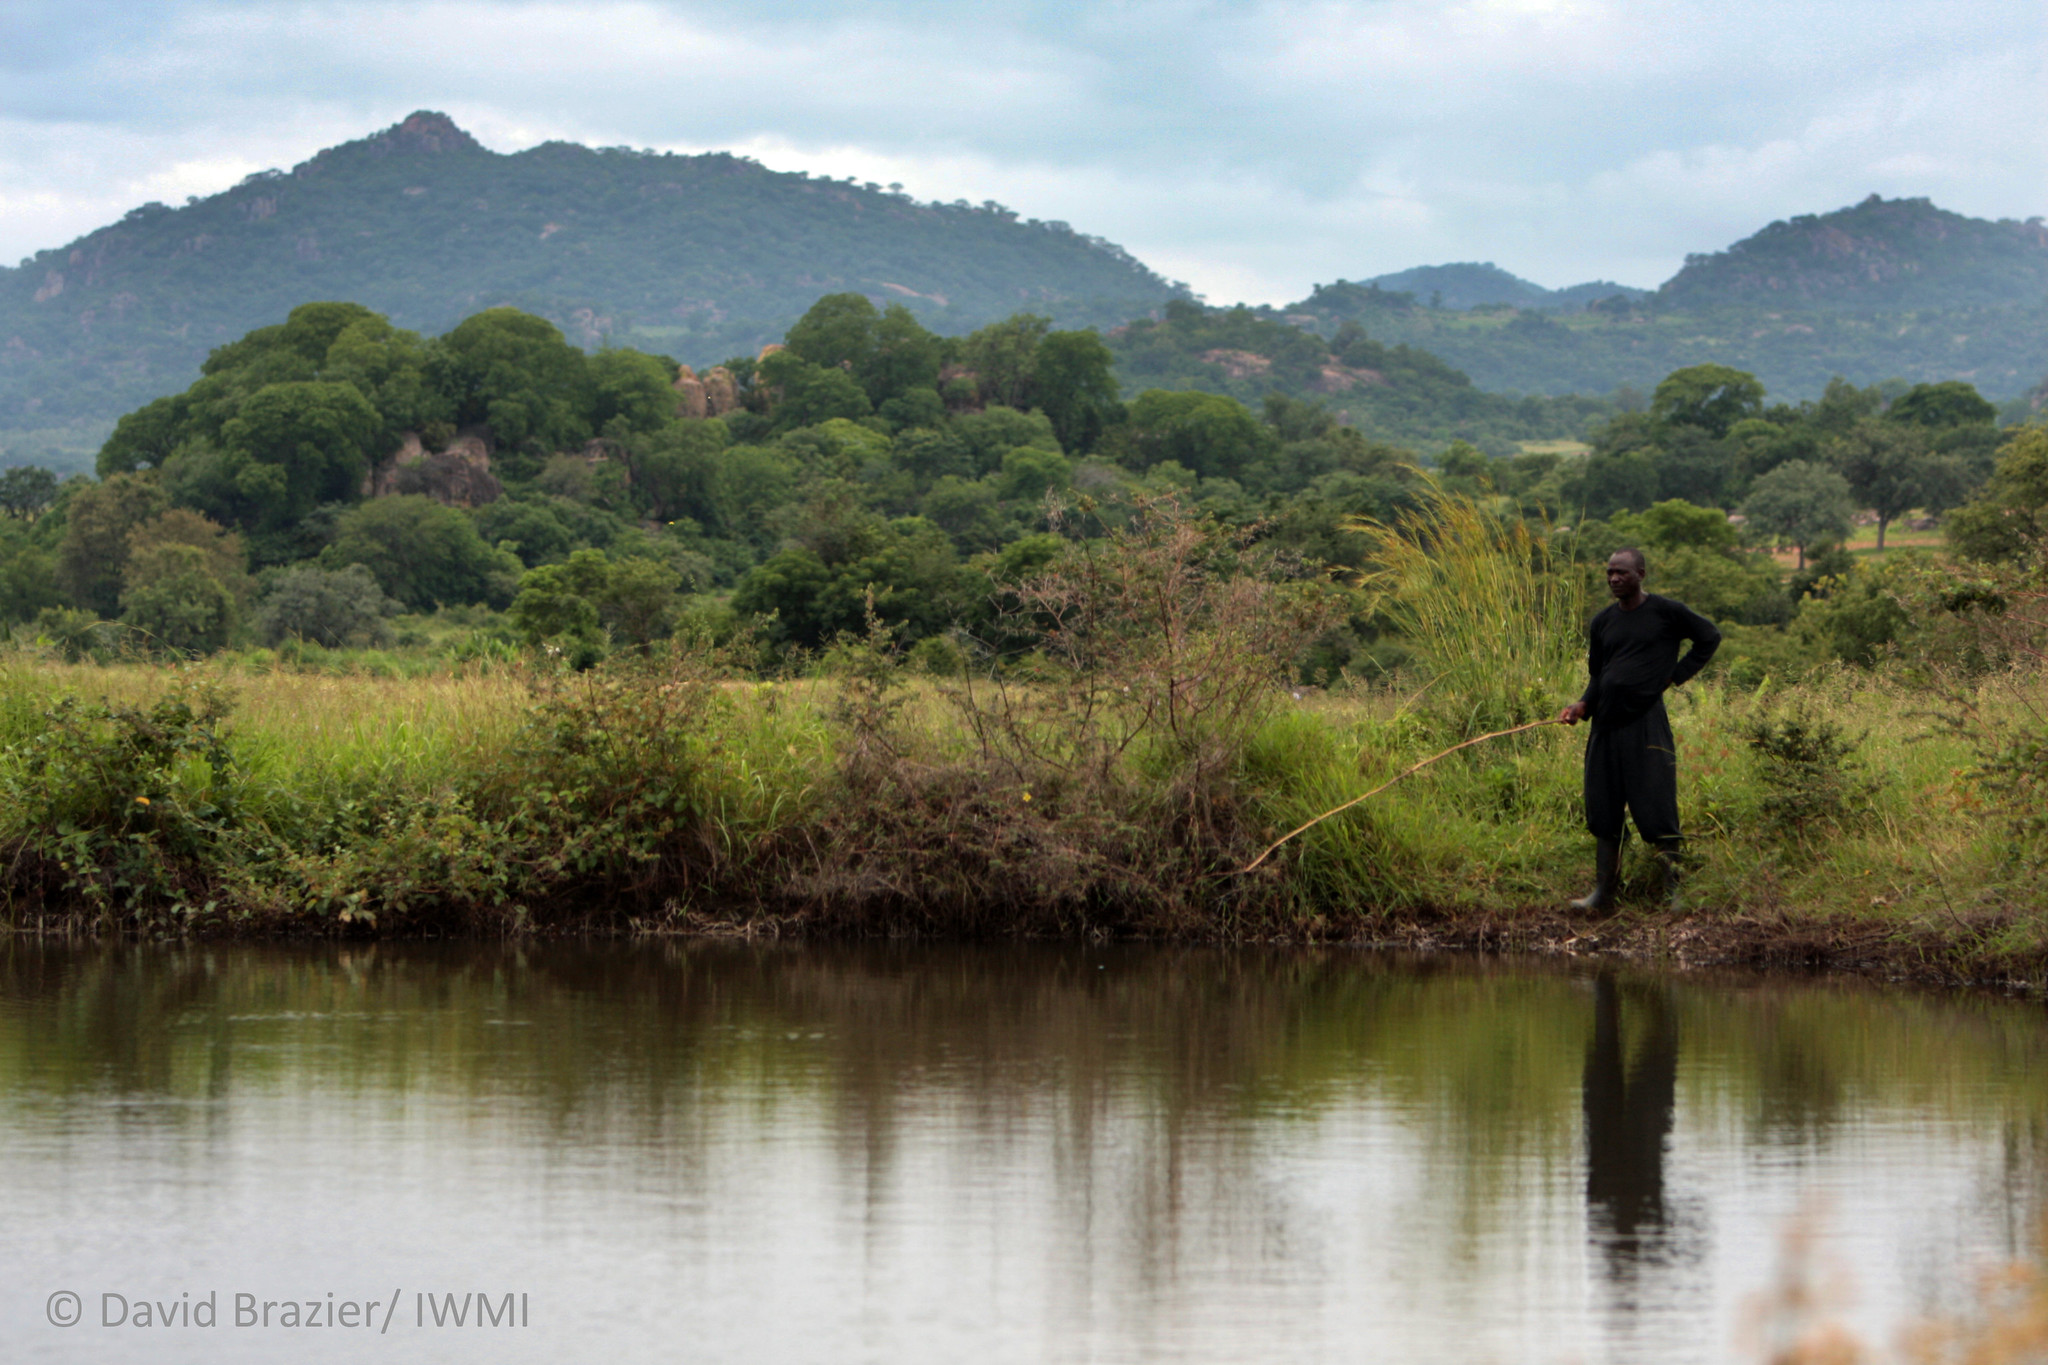
Header image: Storage dam in Zimbabwe. Photo by David Brazier/IWMI.