Welcome to the CGIAR Active Grants dashboards. These dashboards are an interactive tool to help facilitate sharing of information about the various CGIAR grants that are under implementation. We welcome feedback and enquiries from readers on the presentation of the information at dashboards@cgiar.org.
These dashboards have been developed based on the aggregation of the information provided by the 15 CGIAR Research Centers and the CGIAR System Organization. Inter-Center grants have been eliminated in the Funder View dashboard to avoid double counting but are included in the Center View dashboard to illustrate complete Center activities.
A few notes on terminology and methodology used within the CGIAR Active Grants dashboards:
- All amounts are presented in US dollars. Where applicable, values have been converted from originating grant currency into US dollars at the prevailing rate at the time of the grant;
- Pledge amount represents the amount of financial commitment for the entirety of the grant period, inclusive of any amendments, extensions, and adjustments to the original grant agreement;
- Grants are organized by the year of original contract signature;
- Each grant is mapped to the country or countries of benefit and implementation. For purposes of these data visualizations, the amount per country is an average share of each country of benefit or implementation for the grant.
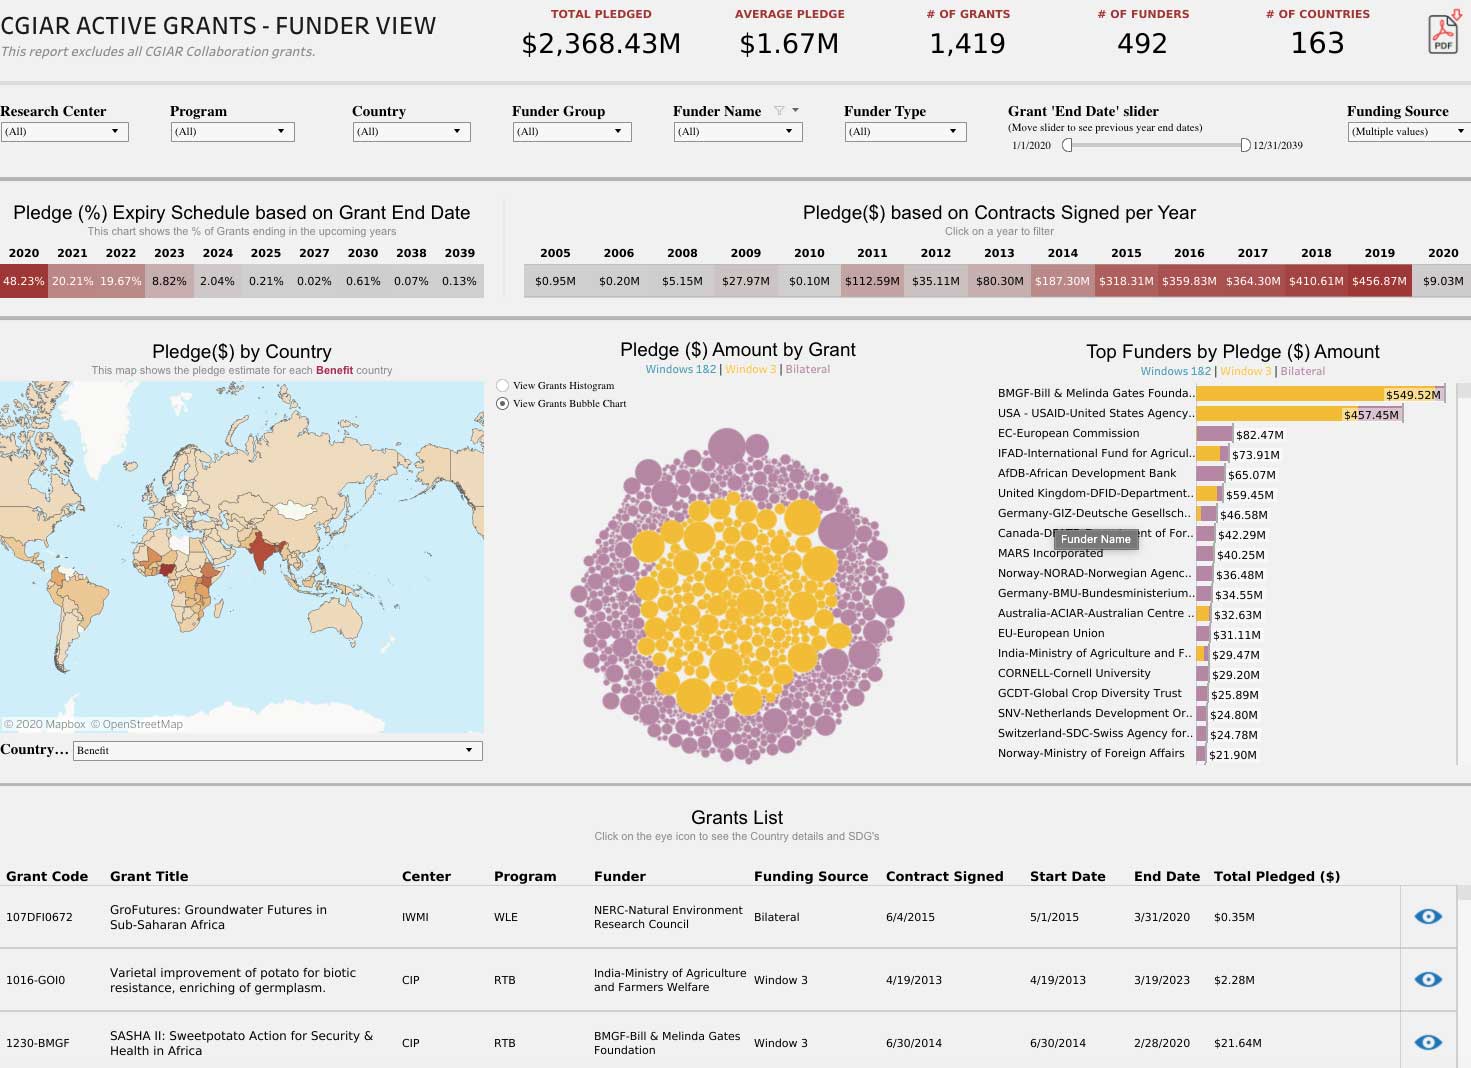
Funder View
This dashboard reports on all the collective Grants of the CGIAR System. Inter-Center grants were eliminated in this view to remove the double counting of pledge amounts and number of grants.
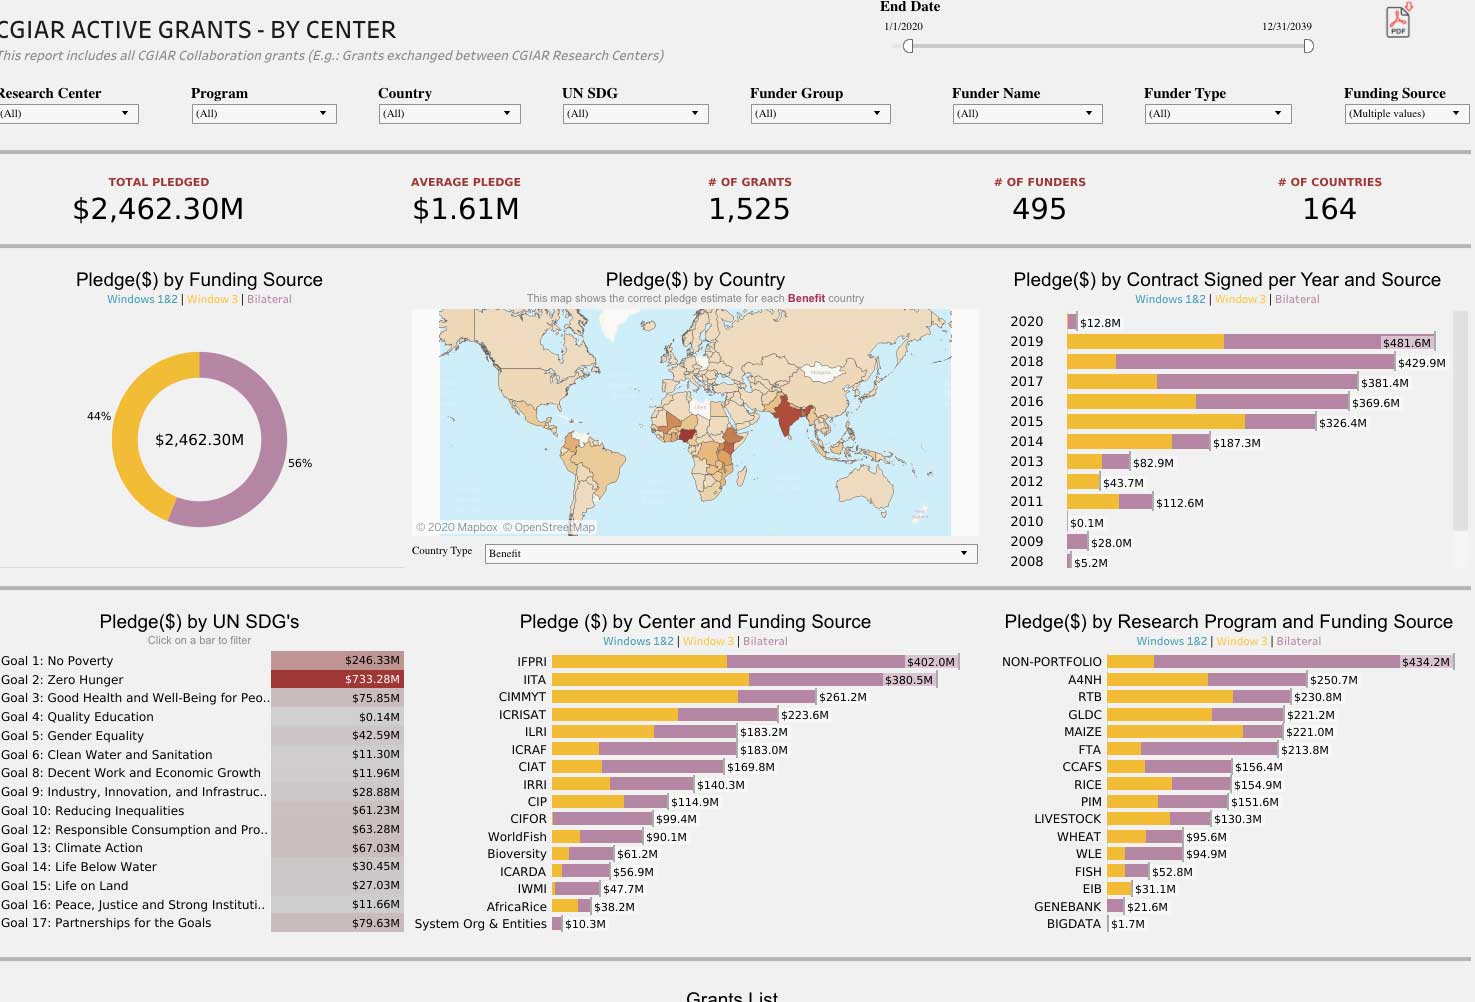
Center View
The dashboard reports on all the active Grants by each Center, including the Inter-Center grants to illustrate their complete Center activities.
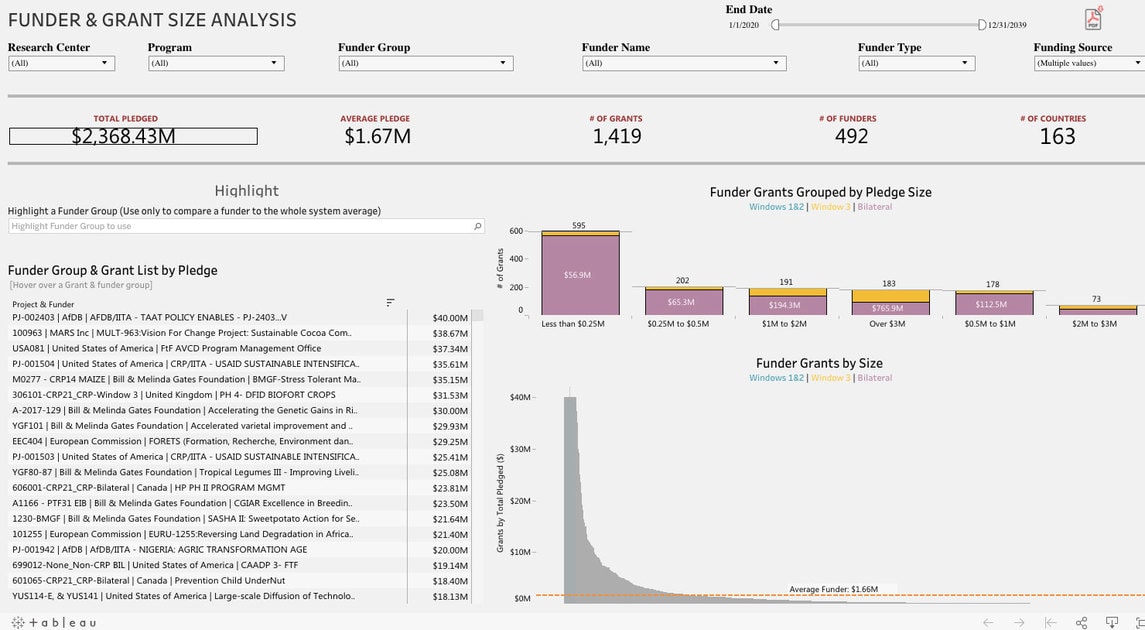
Funder and Grant size
Reports on all collective Grants of the CGIAR System with emphasis on grants size analysis per Funder at System level.