-
From
CGIAR Initiative on Low-Emission Food Systems
-
Published on
21.12.22
- Impact Area
By Birgit Habermann
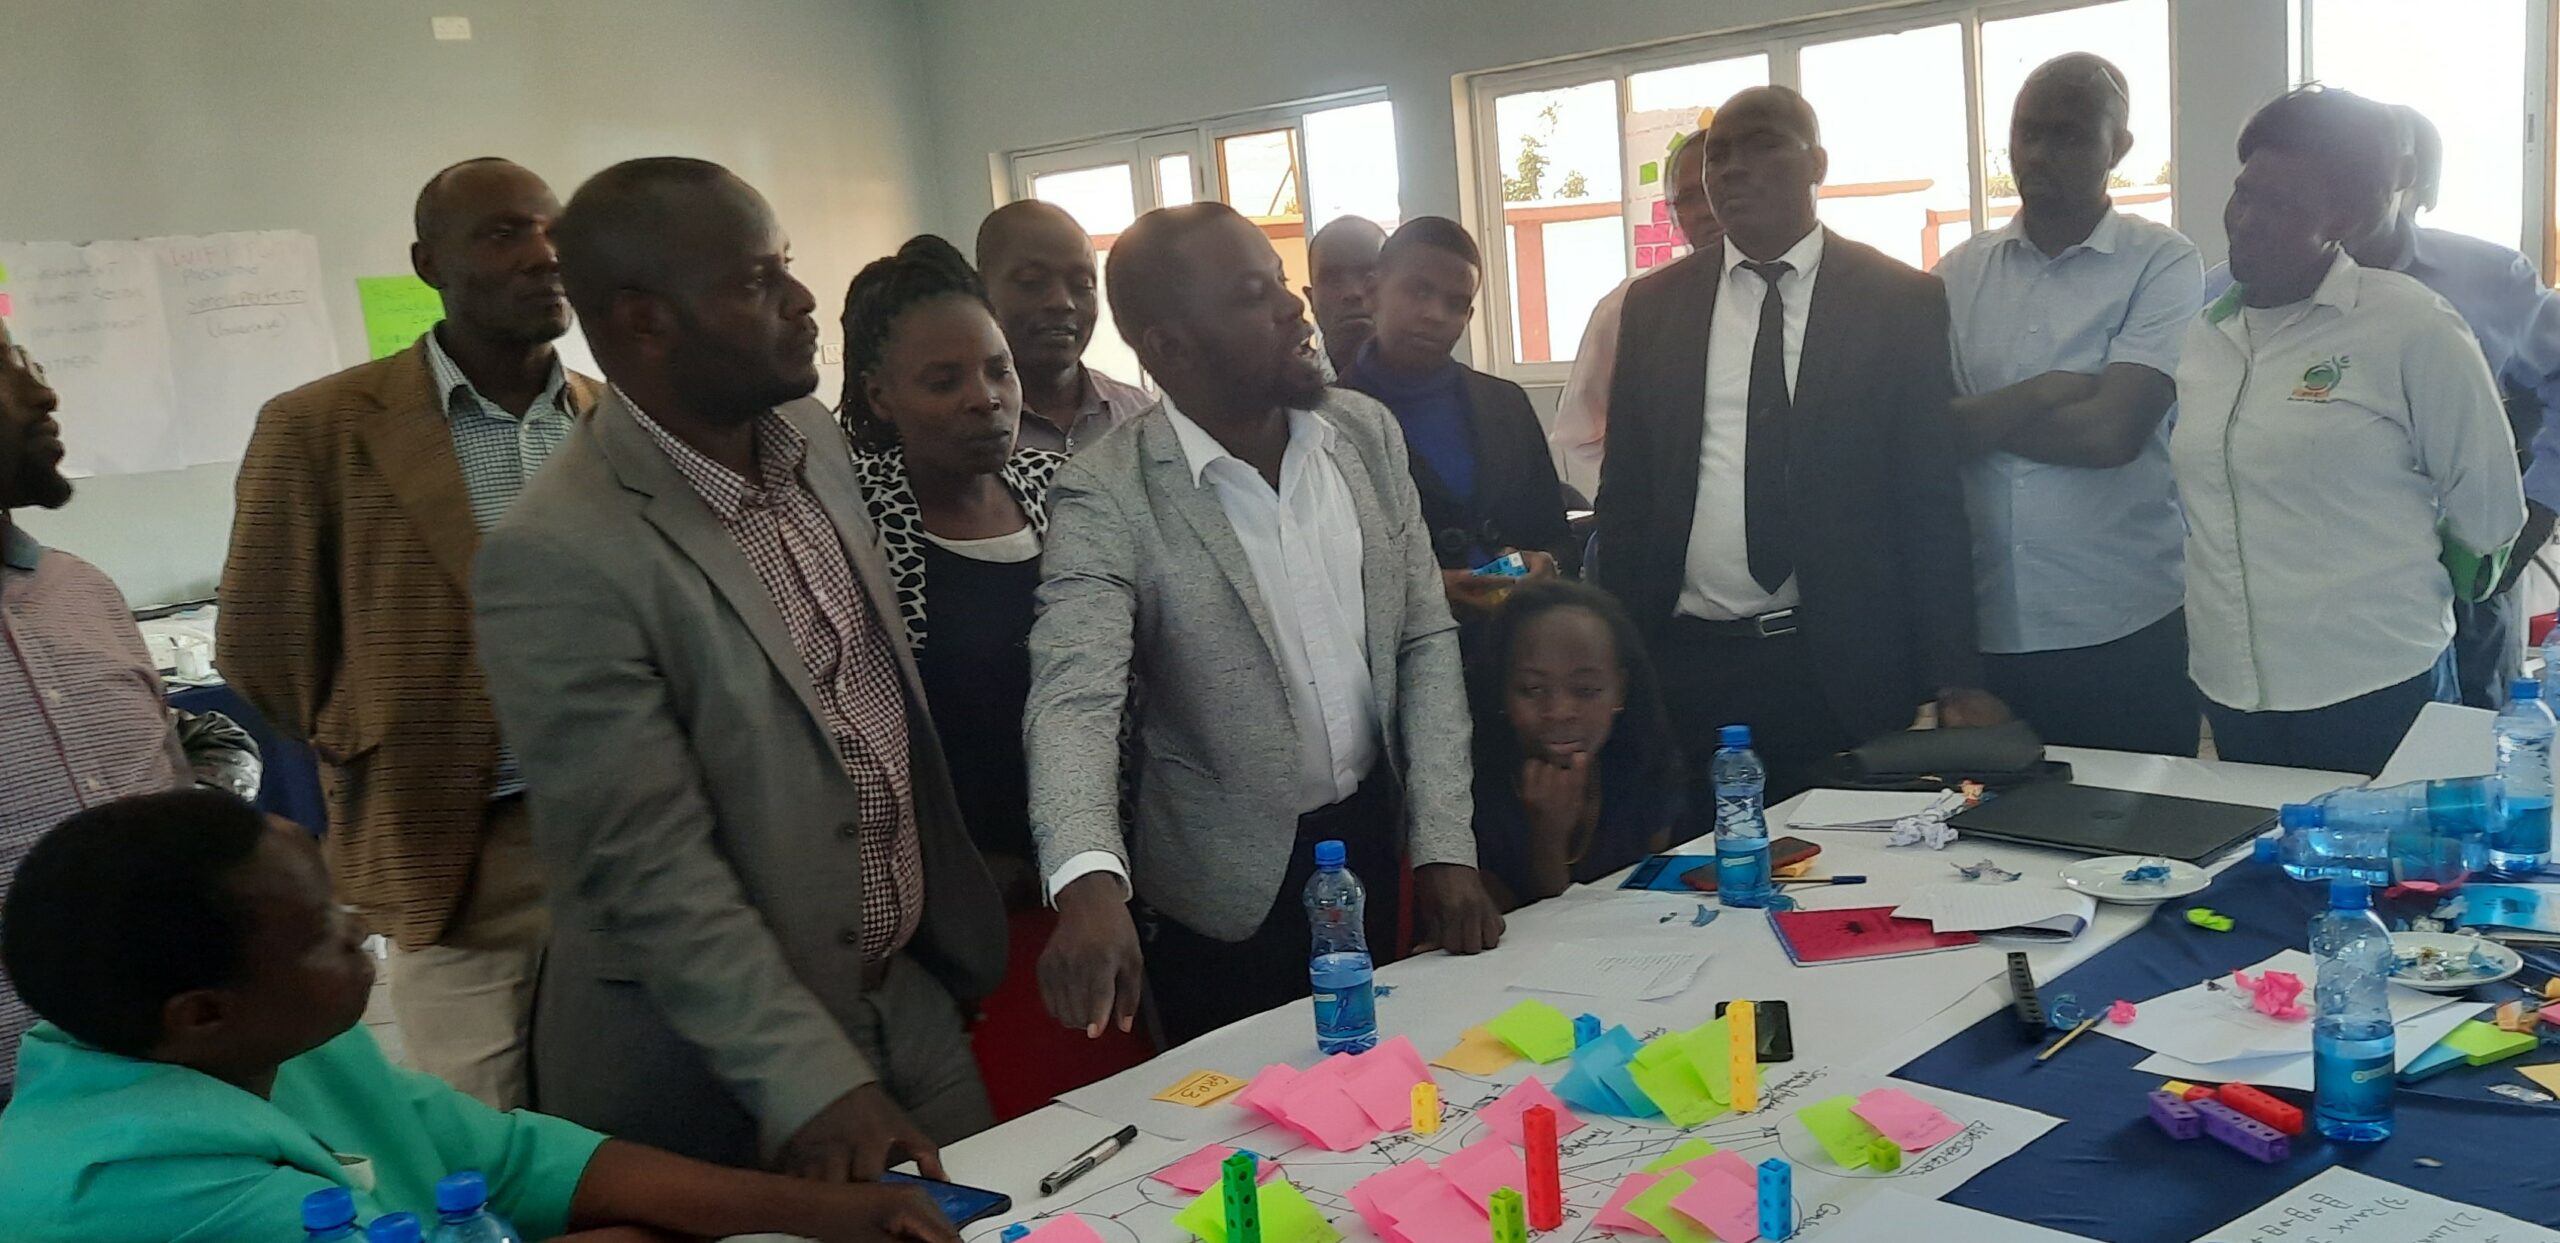
Let us admit it, workshops can be really boring. But they can be fun, too! What are the ingredients for that? First, you need to have the right people in the room. Second, you have to honestly engage them. Third, the engagement should be about something they care about. And finally, use colors and some toys to lighten up the atmosphere. One tool that makes all of these possible is net-mapping.

Net-mapping is a mapping tool based on group interviewing. It helps to visualize certain situations where many different actors can influence outcomes. A net-map helps us to understand the actors are involved in the network, the nature of their linkages are, the extent of their influence on what and whom, and their goals.
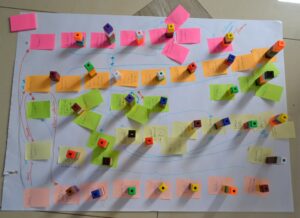
Net-maps can take very different shapes and forms, depending on the dynamics in the groups working on them. Some people create categories from the start and orderly rows of post-its; others spread them out all over the place. Some groups will only make a few arrows; others create a spider web of the highest order. There is no right or wrong: Creativity and group dynamics determine what it is going to be.
When we did a net-mapping workshop in the Nandi county with a group of 35 stakeholders on , the relief on the faces of participants when they saw the colorful papers and bricks on the facilitator table was quite revealing. The people in the room knew each other only to some extent, as the food system in Nandi is complex and diverse.

We had people from the county and some sub-counties as well as farmers and researchers representing livestock, veterinarians, agriculture and crops, environment, forestry and social services and gender. The represented projects were addressing issues of agricultural development across all commodities. There were cooperatives for dairy, horticulture, tea, potatoes — even Equity Bank and the Kenya Consumer Organisation were represented, and several higher learning Institutes and i-Shamba.
Evidently, this led to quite interesting discussions. Is it legitimate to say a farmer has a high stake in leading to the reduction of emissions in Nandi’s food system? Or is his or her role part of a wider network of stakeholders interacting with each other? Can a higher learning institute directly contribute to the reduction of emissions in the long term? What about policies? Are the strategies of financial institutions aligned to government policies or are they purely economic? Are policies as powerful instruments in shaping the actions of stakeholders as we want them to be?
 The most difficult part, as those questions show, is step 3 in our approach: This is where participants get a bag of sorting blocks. These are then stacked to indicate which actors are most influential, in our case in shaping the future of the food system, in particular, in terms of low-emission development.
It is relatively easy to come up with a list of different actors, and this list is usually very long. But deciding who will shape the future in terms of emissions, that is quite a question. To guide such discussions up to that point and avoid that the participants realize that they had the wrong actors listed all along, it is important to follow a stepwise approach:
 Step 1: Who is involved in the Nandi county food system, and who of these actors can also play a role in reducing greenhouse gas emissions? Examples are government and non-government organizations, research organizations, civil society, middlemen and traders, food processors, consumers, producers/farmers. Write the different names on post-its and choose different colors for different categories, such as farmers, research, extension, NGOs or the private sector. Mark the ones that can play a role in reducing greenhouse gas emissions with a dot.
Step 2: How are these actors linked? Make connections by drawing arrows from one actor to the other. We use two categories: financial and information. Please allocate different colors to that. Mutual relations are indicated by arrow heads at both ends.
Step 3: How influential are these actors in shaping the future of the food system, in particular, in terms of low-emission development? Now allocate one to five blocks as the degree of influence, with one with being the least influential, and five the most influential. This will require some discussion. Ensure that the participants are aware of the relational character of this exercise, so if the local government has only one block and the church, for example, has three blocks, then this needs to be discussed.

The net-maps reveal a level of complexity that is hard to come by in a mere group discussion. But the discussion that goes along with the creation of the map is actually the real, interesting part. This also shows when the groups present their maps to each other, which can lead to heated debates. But at the end of the day, even these debates serve the purpose when they show us where we converge and where we diverge in our views, and provide an important learning ground.
“We all got to know each other a lot better, and learned a lot about the food system and its challenges through the discussion. We are looking forward to continue working like this, this has been an exciting workshop!,” said a workshop participant at the net-mapping workshop in Kapsabet, Kenya.
See more information on Mitigate+ here.
Photo credit: Birgit Haberman / ILRI
Related news
-

Progress and challenges in implementing non-market approaches
23.04.25-
Adaptation
-
Mitigation
To date, more than 20 organizations are registered as support providers to implement non-market appr…
Read more -
-

ASEAN-CGIAR Program charts future course, emphasizing scalability and sustainability
15.04.25-
Adaptation
-
Climate adaptation & mitigation
-
Environmental health & biodiversity
-
Food security
-
Mitigation
-
Nutrition
-
Nutrition, health & food security
Bangkok, Thailand - The ASEAN-CGIAR Innovate for Food and Nutrition Security Regional Program recent…
Read more -
-
Study reveals Africa will reach 1.5°C climate change threshold by 2040 even under low emission scenarios
28.02.25-
Climate adaptation & mitigation
-
Mitigation
New research highlighted in CABI Reviews suggests that all five subregions of Africa will breach…
Read more -