Key Messages
- Women in food systems tend to be more negatively impacted by climate risks than men as they are more dependent on agriculture as well as more constrained in responding and adapting to changes in climate because of structural socio-economic inequalities.
- Identifying climate–agriculture–gender inequality hotspots, where climate hazards converge with large concentrations of women participating in food systems and significant structural gender inequalities, enables allocating scarce resources to most-at-risk populations.
- Women’s vulnerability to climate risk is highly contextual; this methodology to identify hotspots can be applied to identify subnational hotspots within countries.
- When root causes of women’s excess risk to climate change impacts are addressed, women can be agents of change in building climate resilience.
Climate shocks and stressors impact women and men in food systems differently
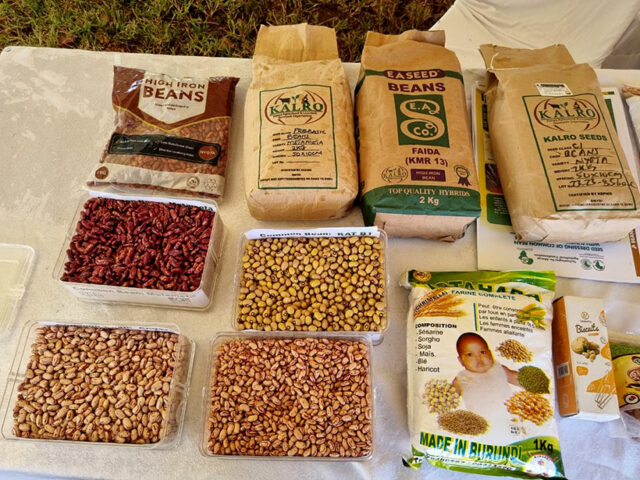
Food systems in low- and middle-income countries (LMICs), particularly in Africa and Asia, face direct stress from climate-induced changes and house a large population of smallholder farmers who are dependent on their immediate environment for their livelihoods, food and nutrition.
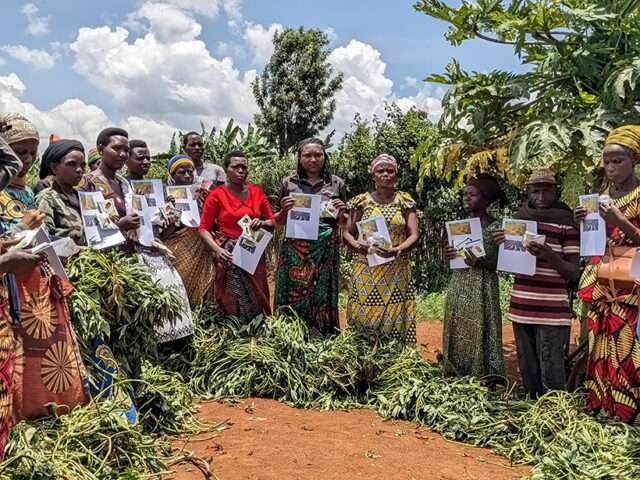
Climate change is a potential threat to gender equality in agriculture and food systems. Women smallholder farmers are more vulnerable than men to climatic shocks and stressors as they tend to be more dependent on agriculture and natural resources and have less diversified livelihoods. Structural gender inequalities impede women’s ability to respond to, adapt to or mitigate climate change impacts. Women tend to have fewer and lower-value assets as well as less access to land, capital, labor, agricultural inputs, and social and institutional networks. Coupled with social norms and gender roles that limit their agency, both at the household and community levels, women’s access to and use of climate-smart technologies is constrained.
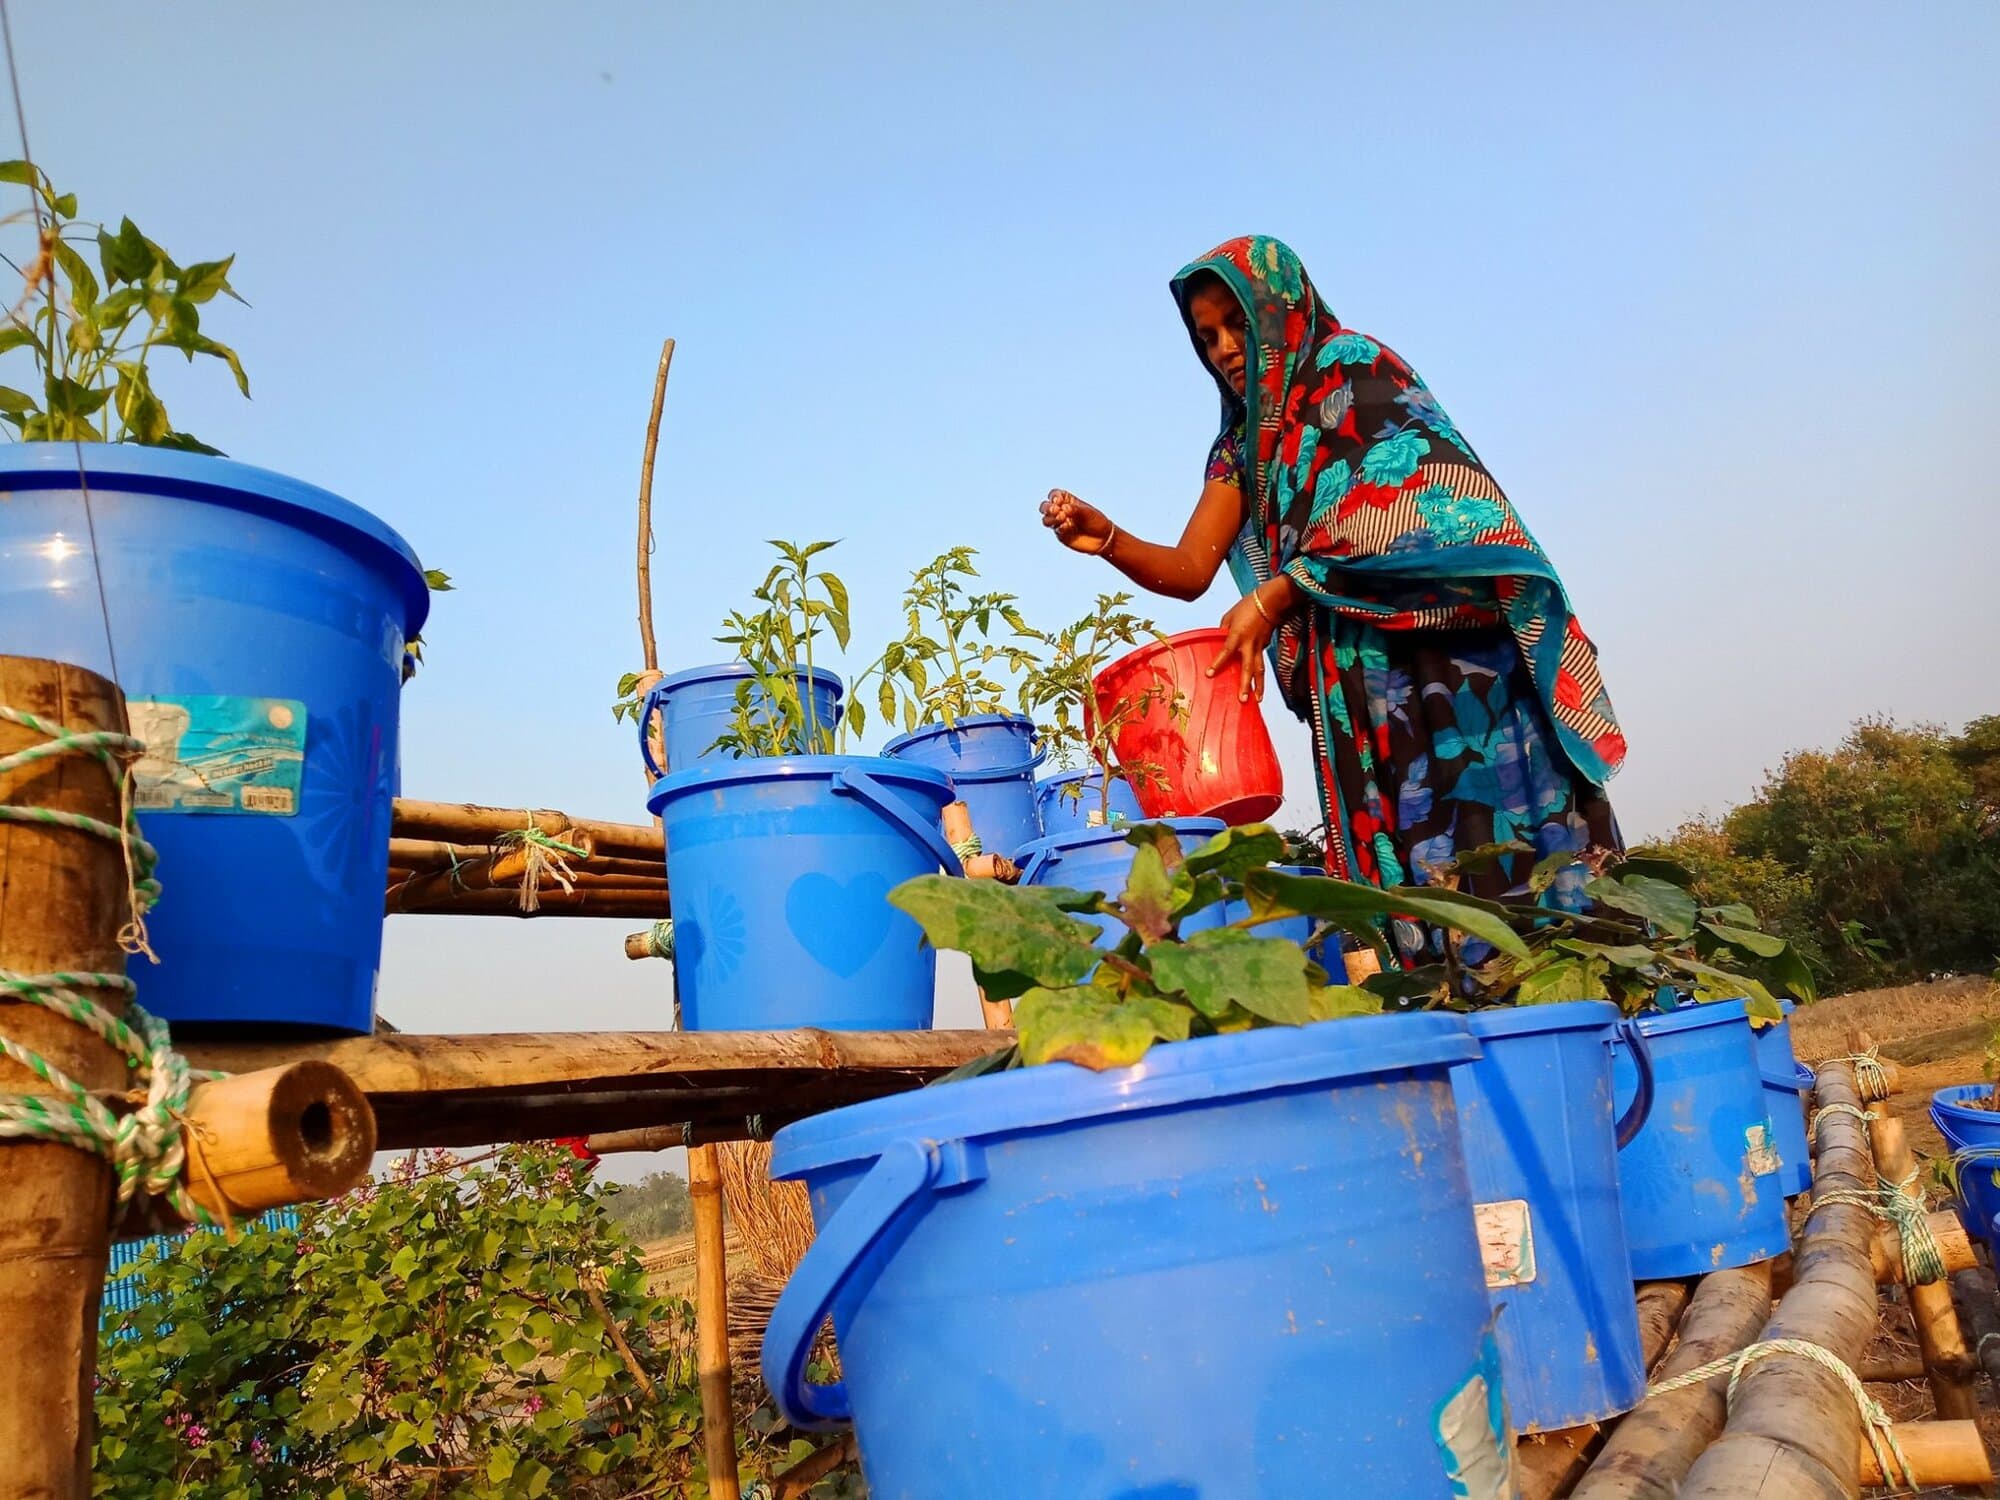
Women, however, can drive efforts to build climate resilience if existing inequalities and the underlying causes are addressed. There is a growing body of evidence of effective ways to do so.
Identifying climate–agriculture–gender inequality hotspots
Identifying hotspots, where climate hazards converge with large concentrations of women participating in food systems and significant structural gender inequalities, enables investors to allocate limited resources to the most-at-risk, most vulnerable populations.
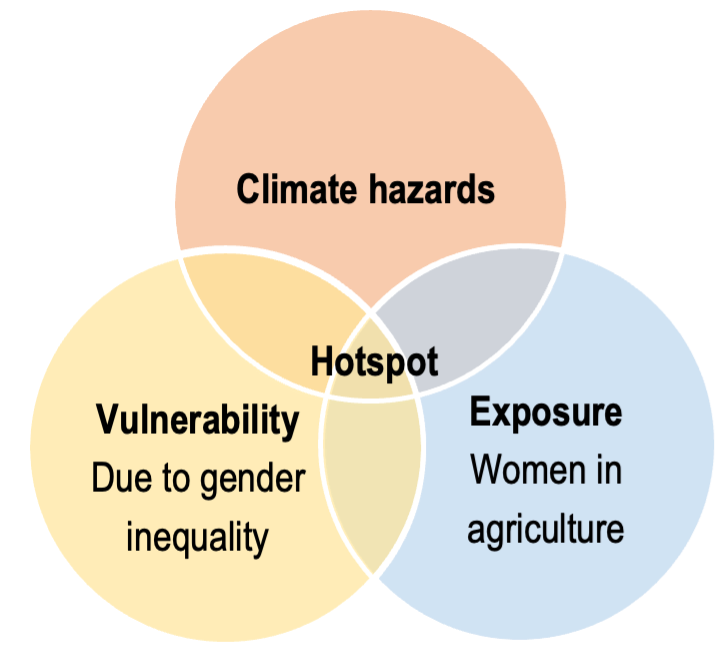
We developed a methodology to identify, rank and map climate–agriculture–gender inequality hotspots. Building on the Intergovernmental Panel on Climate Change’s risk framework and previous research, we define climate–agriculture–gender inequality hotspots as geographical areas where high levels of climate hazards converge with high levels of women’s (labor) participation in agriculture and food systems (exposure) and high levels of women’s vulnerability due to prevailing gender inequalities (figure 1).
Our climate–agriculture–gender inequality hotspot index is based on publicly available representative data with geospatial information capturing i) climate hazards, ii) women’s exposure and iii) women’s vulnerability due to gender inequalities. The hazards are measured by the share of rural population likely to face specific climate hazard types, using data from the CGIAR Research Program on Climate Change, Agriculture and Food Security. Women’s exposure is measured based on their labor participation and hours worked in agriculture, including the relative importance of the crop or commodity, using Labor Force Survey (LFS) data. Women’s vulnerability due to gender inequalities is proxied by five discriminatory social institutions captured in the Social Institutions and Gender Index (SIGI) 2014. We use principal component analysis to construct an ordinal hotspot index based on those data.
African countries are climate-agriculture-gender inequity hotspots
LMICs were then ranked by the climate–agriculture–gender inequality hotspot index and visualized on a global map (figure 2). Table 1 presents part of the hotspot ranking. For instance, Gabon is the ‘hottest’ as it scores highest on the index. ‘Coolest’ countries are the Dominican Republic and El Salvador. The methodology was applied at a subnational level to four relatively hot, data-rich countries, including Mali and Zambia in Africa, and the ‘hottest’ Asian countries, namely Pakistan and Bangladesh.
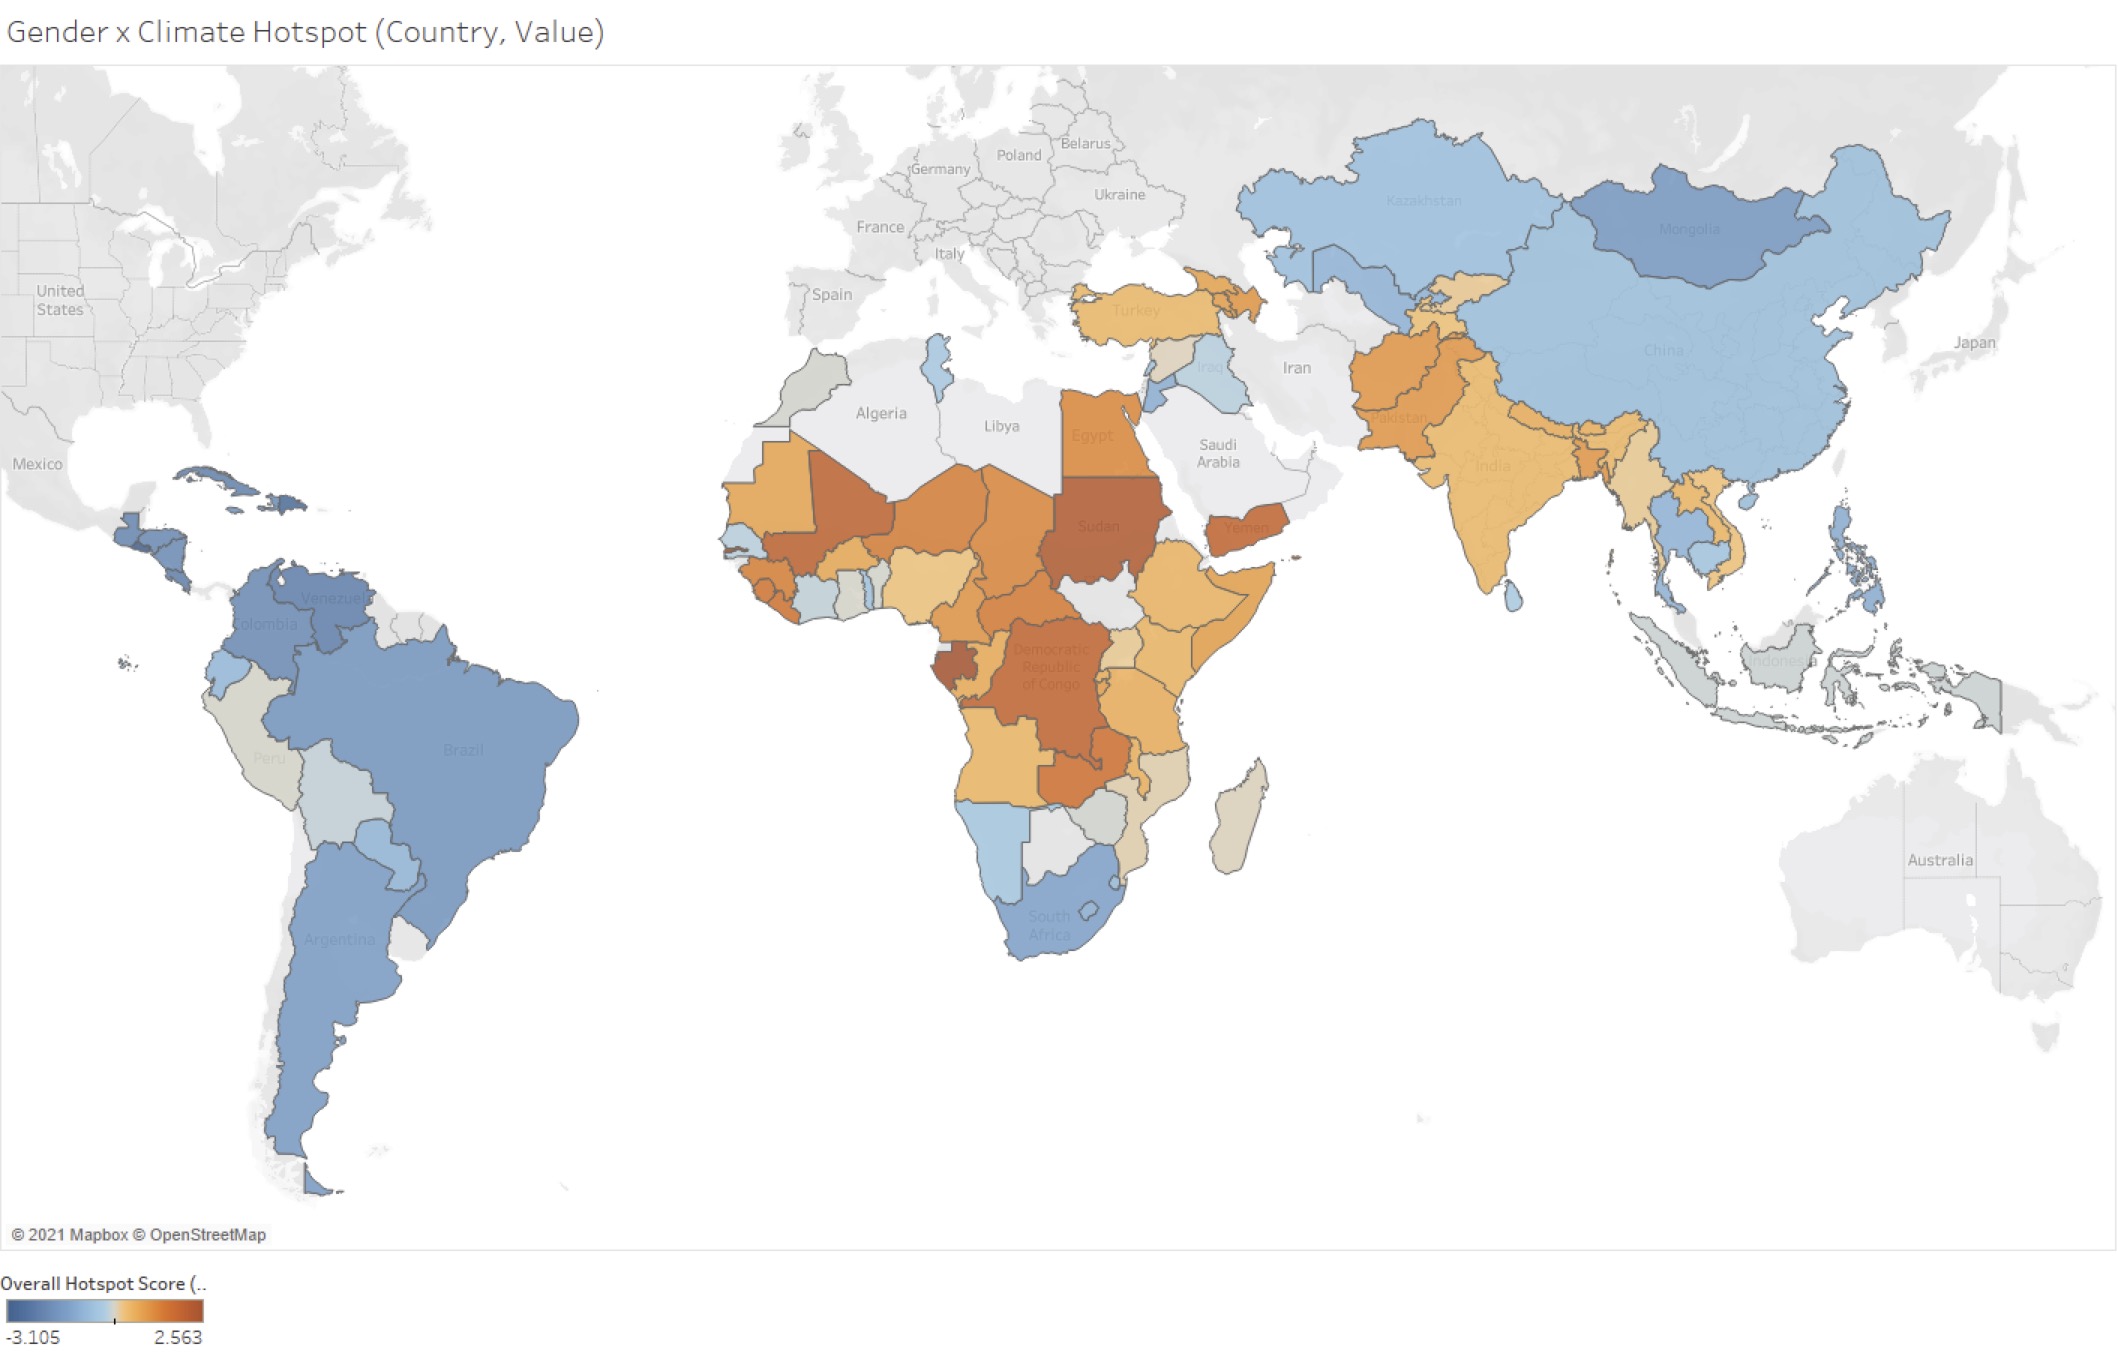
Note: Darker, orange-colored countries are ‘hotter’ with higher risk as they have a relatively high hotspot index value. Darker, blue-colored countries are relatively low risk with lower hotspot index values; therefore, they are ‘colder’. LMICs with a light gray color have not been ranked due to data limitations.
| Ranking | Country | Overall hotspot score
(the higher, the hotter) |
|---|---|---|
| 1 | Gabon | 2.563 |
| 2 | Sudan | 2.328 |
| 3 | Gambia | 2.100 |
| 4 | Mali | 2.028 |
| … | ||
| 7 | Zambia | 1.639 |
| … | ||
| 16 | Pakistan | 1.029 |
| 17 | Bangladesh | 1.026 |
| … | ||
| 33 | Kenya | 0.523 |
| … | ||
| 36 | India | 0.474 |
| … | ||
| 86 | Dominican Republic | -2.725 |
| 87 | El Salvador | -3.105 |
Table 1. Examples of countries’ rankings by climate–agriculture–gender inequality hotspot index.
Zooming in on climate–agriculture–gender inequality hotspot areas within countries
To identify crop/category specific climate–agriculture–gender inequality hotspots at the first administrative subnational level (e.g., province or region) in the four selected countries, we used a similar approach, but slightly different data. We used the same indicator of climate hazards, but at a finer grid. For women’s exposure, we used LFS data, but included women’s share in labor participation and share of hours worked for six specific crops or categories. The indicator of women’s vulnerability due to gender inequalities uses similar components as the SIGI 2014, but derived from other data representative at subnational level, more specifically, the Gender Development Index (2019), child marriage prevalence (based on LFS data), domestic violence prevalence (demographic and health surveys) and son bias (census data).
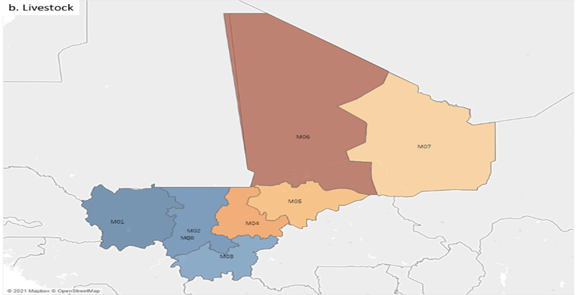
For instance, the subnational mapping for Mali reveals that Tombouctou Region in northern Mali is a hotspot for livestock (figure 3), suggesting that women engaged in livestock keeping are experiencing high climate risk, which is corroborated by other evidence. Tombouctou region is characterized by a pastoralist livestock economy and is experiencing increasingly warm and (extended) dry weather. Women in pastoralist livelihoods in the Sahel contribute a large share of labor to livestock keeping, even if they are less likely to control livestock. Women in Toumbouctou are subject to restrictive norms and roles hindering their mobility and their access to resources, services and diversified livelihoods. They face heavy domestic and care workloads, along with increasing productive workloads because of male outmigration.
Relevance and use of climate-agriculture-gender inequity hotspot methodology
Mitigating women’s disproportionate risk to climate change impacts in agriculture and food systems, and enabling them to be agents of change in building climate resilience, requires addressing root causes of gender inequality. The identification of hotspots can support effective targeting to channel climate resilience-building investments to countries and areas where women are the most at risk. It can be used for national, regional or temporal comparisons and help assess effectiveness of resilience-building policies or programs.