Interested in how CGIAR is contributing to the Sustainable Development Goals (SDGs)? Looking for more information about CGIAR’s partners and how they work with different CGIAR Research Programs and Platforms? Or how about a very specific piece of information, for example, how has CGIAR contributed to policies in the Philippines on the subnational level? Now all of this and more can be found in once place — the new CGIAR Results Dashboard.
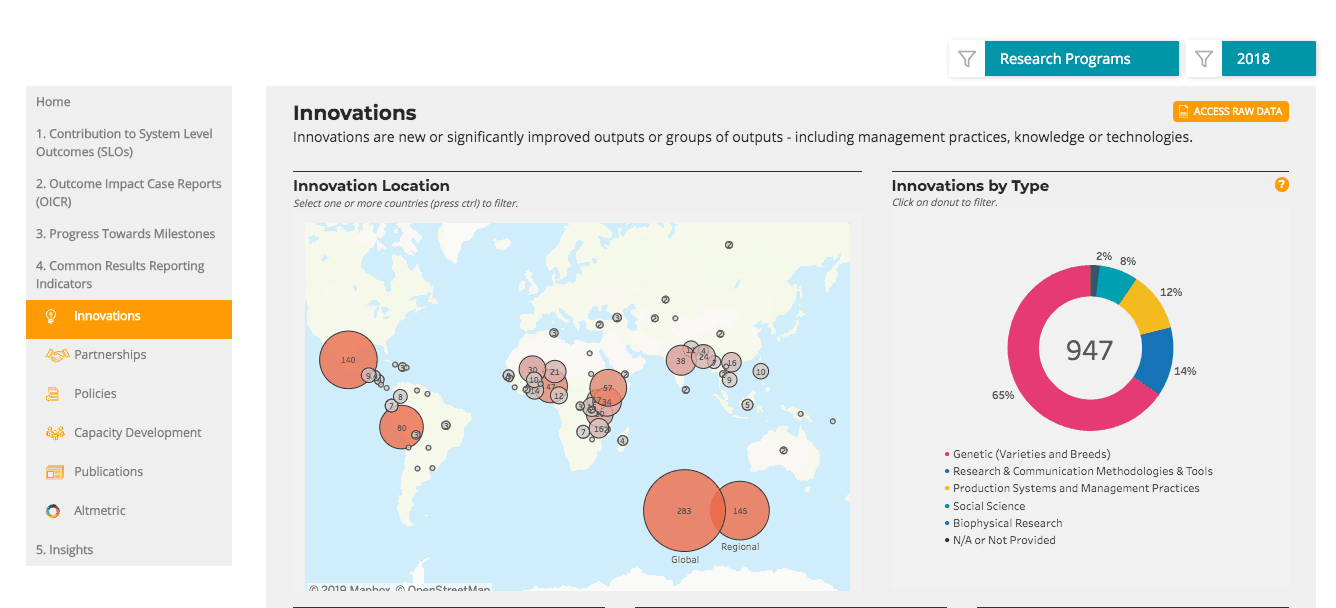
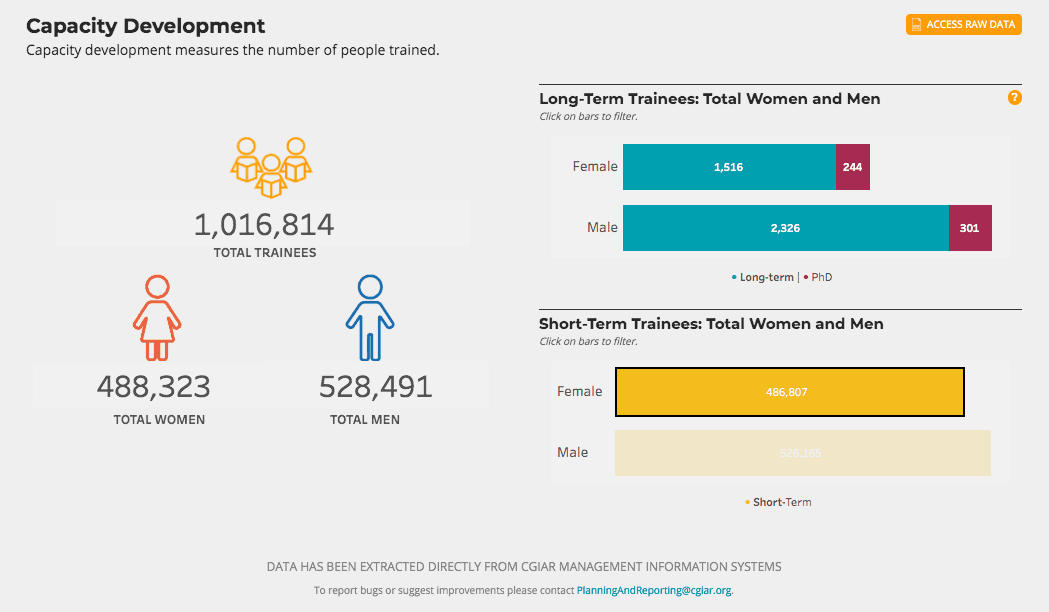
The dashboard gives users the ability to directly interact with results data from across the 15 CGIAR Research Programs and Platforms from broad and common topics to in-depth personalized data, depending on the user’s search parameters and interests. Aspects captured by the dashboard include publications, innovations in management practices, knowledge and technologies, and numbers of people trained among other metrics. For Funders, the dashboard can provide information about CGIAR in an easier and quicker manner.
“The Dashboard is a first for collaboration across the whole of CGIAR. It’s also a first for providing users with the means to dig deeply into the research-for-development that we do in partnership, as well as the evidence of outcomes and impacts from our work,” said Sonja Vermeulen, Director of Programs, CGIAR System Organization.
MAKING DATA MORE TRANSPARENT
The dashboard was created with the CGIAR Strategy and Results Framework and CGIAR’s vision for the future in mind. The dashboard went live on the CGIAR website recently with data collected from 2017 and 2018, and the developers say the tool will continue to evolve as more data comes in and the functionality is improved, such as more sophisticated filters.
Taking an impressive step in transparency, anyone who logs on to the dashboard can access and download the raw results data from all of the CGIAR Research Programs and Platforms.
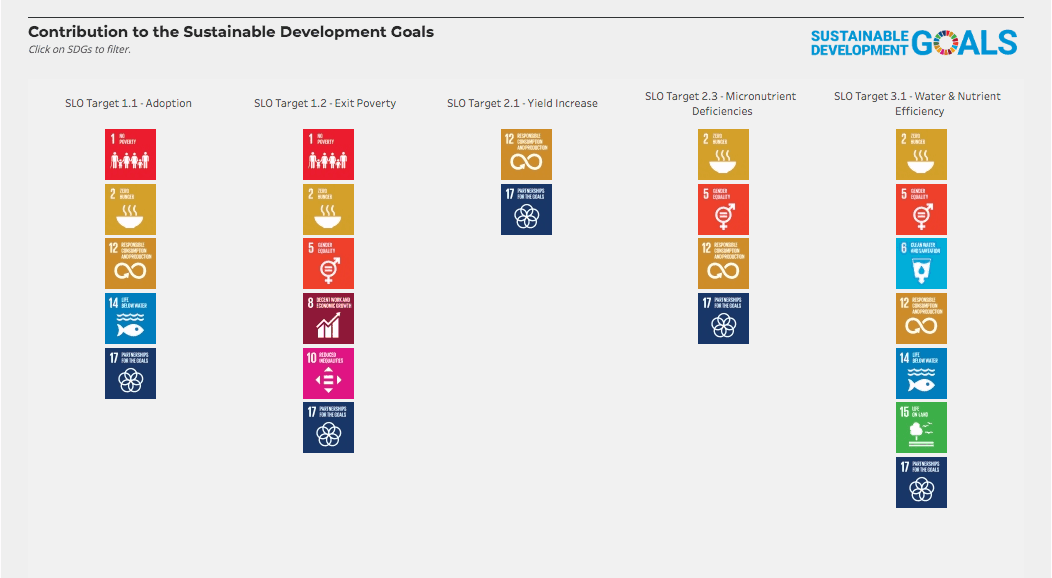
“This is the first time that CGIAR’s collective contribution to the SDGs is available in granular detail to everyone who is interested, including our Funders, our partners and the users of our science,” said Vermeulen.
A TOOL FOR ALL
The dashboard will look familiar to readers of the CGIAR Performance Report as it was developed and organized with the same sections, making it easier for the same audience to find CGIAR results data. Dashboard developers are hoping that the digital format and new data display method will engage new users.
“We are really excited to share this dashboard and we’re even more excited to be making improvements already, so do please help us with your feedback,” said Vermeulen, adding that feedback can be sent to PlanningandReporting@cgiar.org.